This UAS Tutorial video is brought to you by America View,
a nationwide consortium for remote sensing education, research, and geospatial applications.
This project was supported by a United States Geological Survey Grant
and its contents are solely the responsibility of the authors
and do not necessarily represent the officials views of the USGS.
Mention of trade names or commercial products does not constitute their endorsement by the U.S. Government.
Hello everyone, Welcome to Part 5,
the last part of our video series
on "Using Small Unmanned Aircraft Systems to Assess Rainwater Harvesting Potential for Urban Multi-Family Housing".
This part of our video series is titled, "Land-Cover Characteristics & RH Potential",
and in it we will discuss some of the steps taken to accurately characterize your site's land-cover
in order to quantify its rainwater harvesting potential.
Now that we have finished processing our sUAS images into a high resolution orthomosaic,
we can characterize the land-cover into pervious and impervious classes,
and quantify the site's rainwater harvesting potential.
[no narration]
For this video, I will discuss four main topics.
The first topic is Land-Cover Classification concepts.
The second is Creating Classes.
The third is Calculating Ratios and Areas.
And the last topic is Calculating Rainwater Harvesting Potential.
[no narration]
Now the first thing we need to understand when characterizing land-cover is the difference in Pervious and Impervious land.
Impervious land does not allow for the infiltration of water,
and would consist of land cover like concrete and asphalt.
Pervious land, however, is porous and allows for water to infiltrate.
Pervious land would consist of land cover like grass or soil.
In urban areas there are often significantly higher amounts of impervious surfaces,
which often contribute to urban flooding and erosion.
Since so much of the urban environment now consists of concrete, metal, and asphalt,
there is a greater need to be aware of stormwater runoff,
since that water no longer penetrates into the ground.
Also, rooftops are generally grouped with impervious
surfaces since rainwater just runs off when it lands on them.
If we treated rooftops like a pervious land-use category,
and collected the water that fell on them,
then they would no longer act like impervious surfaces and contribute to the problem of urban flooding.
When deciding to perform a Land-cover classification on aerial imagery,
you need to determine what method you want to use.
There are various methods for various needs,
so it all really depends on your project's features.
The most common forms of image classifications are Semi-automated pixel-based classifications,
like Supervised, which makes use of training samples of pixels to determine each image pixel's class.
Unsupervised is another method that can be used, and it generally will require a lot of error correction.
Manual Classification is another method that can be used.
It typically involves the researcher manually digitizing the class from the imagery.
For our Garden Apartment example, manual classification should work the best.
With Manual Classification, there are several pros and cons that should be noted.
This method does typically provide greater accuracy, less error, is quite simple,
and works well for small sites.
However, some of its drawbacks are that it is time consuming, repetitive, there is opportunity for human error when digitizing,
and it does not work well for large sites.
[no narration]
So now that we understand why we want to use a manual classification method,
let's go through the workflow that will be used for our Garden Apartment site.
First we will want to upload our orthomosaic to a GIS platform,
which in our case is ArcMap 10.5.1.
Next, we will plan to clip our orthomosaic to a boundary shapefile,
which in our case will be the parcel boundaries provided by the city government.
After clipping our map, we will then want to create our feature classes,
which will be Pervious and Rooftops for now.
Once they are created, then we will utilize the Editor tool to create new polygons for our classes on top of our orthomosaic.
The editor tool will allow us to digitize all of the buildings' rooftops as our rooftop class,
and all of our pervious areas as our pervious class.
Then, in order to create our Impervious class without rooftops we will need to use the Erase Tool to erase Pervious from our
boundary shapefile. This will result in an Impervious layer that includes the rooftops,
so we will need to erase the rooftops from it to create an Impervious layer without rooftops.
Then our Manual Classification will be finished and we will have all of our three classes completely digitized.
I'll plan to go through each of these steps more in-depth to provide greater clarity.
[no narration]
So going back to step 1, we will want to upload our orthomosaic to our GIS Platform.
Therefore we first need to open ArcMap.
After we have it open, we will want to add our orthomosaic.
With our orthomosaic added, we can now get ready to clip it to our boundary file.
For our boundary, we are using the parcel shapefile provided by the city government.
So, open up the Clip tool which is under the Data Management toolbox.
You then want to select the input raster, which will be our orthomosaic, and we will want to select our output extent,
which will be our parcel boundary.
Lastly, choose a save destination for the output file and then click OK to start it.
When the tool has finished running, you should end up with a nice and tidy clipped image.
Now we want to create our feature classes, which will be Pervious and Rooftops.
This can be achieved by simply right clicking in ArcCatalog and creating a new feature class or shapefile.
When our feature classes are created, then we can move onto the editor tool.
This tool will allow us to physically draw over our image and create the polygons that will be used for our measurements.
To start our editing session, you need to click Start Editing on the editor toolbar
and select the layer that you want to edit first.
You won't be able to digitize the rooftops and pervious layer at the same time,
so this process will be repeated for each layer.
With our editing session started, we can begin digitizing the rooftops.
And the pervious areas. Also, it is worth noting, that this process can take a bit of time to complete since we
have to draw every piece of pervious land and every single rooftop in the site.
Like I mentioned before, this is one of the drawbacks to this method,
but it is well worth the effort when you see the results.
Once we have all of our pervious and rooftop polygons created,
we then only have to worry about the other impervious surfaces that have not been digitized.
Since we already have all the pervious areas and rooftops classified,
then the only areas left are assumed to be impervious.
In order to include every possible nook and cranny on our map in the impervious class,
we will need to follow a different method to digitize the rest of the impervious surfaces instead of manually digitizing it like the others.
To accomplish this, we will use the Erase Tool which will be used to first remove all pervious
polygons from the overall parcel boundary shapefile.
This will result in an impervious layer that includes rooftops, so we will give it a name that indicates it has no pervious areas.
With the new impervious layer,
we can then use the erase tool again to remove the Rooftops polygons from our new layer.
This process should result in a final output layer that is Impervious without rooftops,
with a name that matches.
And now that our impervious layer with no rooftops is finished,
we now have our three classes created and fully digitized.
[no narration]
With our classes fully digitized, we can now determine the land cover characteristics.
In order to do this, we will need to calculate the total surface area for each of the three classes.
With these area measurements, we can do some simple math and calculate the land composition ratios.
[no narration]
The first step we need to take to calculate the area measurements is to add a new attribute field in each of the three class layers.
This field can be named Area_sqft.
This field will contain our measurement values.
After the attribute fields are created, we then need to populate them with measurement information.
To do this, we will use the Calculate Geometry tool that can be accessed by simply right clicking the field name
and clicking Calculate Geometry.
When it pops up, we will need to select the coordinate system for our layer,
and select the measurement units we want.
For our project, we will use square feet to measure the areas.
After you click ok then the field values should automatically fill up with area measurements in square footage.
Make sure to calculate the geometry of all the polygons in each of the three classes.
[no narration]
Once you have finished calculating the geometry for all of your classes, then you should have your measurement results.
For our Garden Apartment Site, the total area of the site was approximately 800,000 square feet.
Of that, about 127,000 square feet, or 15.84%, consists of Rooftops.
About 271,000 square feet, or 33.83%, consists of impervious surfaces excluding rooftops.
And 403,000 square feet, or 50.32%, consists of pervious land cover.
So now we have a full understanding of the land-cover characteristics for our site and understand its composition.
Now that we have our land-cover characteristics, we can accurately calculate the rainwater harvesting potential.
Before we crunch some numbers, there are just a couple concepts that need to be recognized.
The first is that we need to keep in mind, we are considering rooftops as our rainwater catchment areas,
so we will treat the rooftop class as if it were a catchment area.
Secondly, we are only calculating the theoretical rainwater harvesting potential,
so the results will obviously vary depending on real-world conditions.
And lastly, our rainwater harvesting potential will depend on our local climate.
If you live in an area with very little precipitation, then your results might not prove as significant.
However, our site is located in Alabama and receives lots of rain every year.
There are also a couple assumptions that need to be addressed,
in order to better understand the numbers we generate.
The first assumption is that evaporation is not accounted for.
There are formulas out there that can account for it, but for our project goals it is not necessary.
Our second assumption is that the land characteristics from our site is independent from adjacent properties,
therefore we are not addressing any influences from neighboring land.
And our last assumption is that water quality and storage are not accounted for.
We are only interested in the theoretical potential, so quality and storage are not of interest to our project.
Now that we have addressed some assumptions and concepts,
we can take a look at the general method for calculating the potential.
This method follows a very simplistic mathematical formula that only requires the rooftop dimensions
and the local precipitation trends.
Since we know that for every 1 inch of rain that falls over 1 square foot of land,
.62 gallons of water are generated, we can use this to determine the total volume in gallons that our property would be
able to theoretically harvest.
So, when thinking about our Garden Apartment Site, we can follow this formula.
First we need to take our rooftop dimensions,
which is about 127,000 square feet, and our precipitation trends,
which is 53 inches per year,
and multiply them together with our .62gallon conversion factor.
Once you have multiplied these three numbers, then you should finally have the total volume in gallons that can
theoretically be harvested at our site.
For the Garden Apartments Site, approximately 4.17 million gallons of water can be harvested per year.
This is a significant amount of water that would otherwise be considered run-off that
would contribute to urban flooding or burden on the stormwater management system.
If you want to figure out what the volume would be monthly, weekly, or daily, you can always adjust your
precipitation trends to match those time periods too.
So now that we have finally classified our site and calculated our rainwater harvesting potential,
we can take a look at our results and see what we think.
For the Garden Apartment Site, we learned that 50.34% of the parcel is pervious,
and 49.66% is impervious.
Within the parcel, rooftops actually consist of 15.84% of the land-cover,
which is a sizeable amount.
Taking into account these measurements, we were able to determine that the theoretical rainwater harvesting potential per year is
about 4.17 million gallons.
So hurray, we successfully derived the rainwater harvesting potential
and land cover characteristics of our site using sUAS imagery.
But before we conclude this series, I want to make a few remarks that are worth considering moving forward.
The first is that although our study focused on rainwater harvesting potential,
these measurements can be used for many other types of studies,
such as solar potential, green roofing, or urban design.
Another thing to keep in mind is that we utilized a simplistic calculation to determine the theoretical harvesting potential,
but there are many other comprehensive methods available.
What if you are concerned with evaporation rates, or diverting the first flush of rainwater?
Or what if you are concerned with water quality and how it can be used?
What about the effects of rainwater harvesting on urban flood dynamics?
These are all questions that can be answered, but they each require differing methods.
And my last remark is that although a small unmanned aircraft system was used to derive our map data, it is not absolutely necessary.
When a sUAS is not suitable for the study,
then satellite imagery or airborne imagery might be preferable.
However, arguably, the sUAS will still provide the highest-resolution imagery that can be obtained currently.
And the high map quality will lend itself to high quality results.
So, that is it for our series on Using Small Unmanned Aircraft Systems to Assess Rainwater
Harvesting Potential for Urban Multi-Family Housing.
During our first video we briefly discussed what Rainwater Harvesting is and why it matters.
Our second video detailed some of the sUAS laws and regulations that researchers need to be aware of.
Our third video discussed the image collection process with a sUAS and what settings tend to be ideal for this type of work.
Our fourth video went through the image processing phase and illustrated some of the potential map outputs that can be derived
from sUAS imagery.
And our fifth, and final, video has concluded the series with the methods for classifying
the land cover and determining the rainwater harvesting potential. I hope that these five videos have proven
themselves useful to you in your research endeavors with small unmanned aircraft systems.
If there is anything that you are confused about, I highly recommend going back through our video on that
specific topic to make sure everything is fully understood.
This series is by no means intended to be the sole authority on accomplishing these goals,
but it does provide a simplistic and direct method for obtaining these results.
I appreciate your time watching our series.
Thank you for watching!
 For more infomation >> Robin McGraw Shares Passion For Helping Victims Of Domestic Violence - Duration: 5:34.

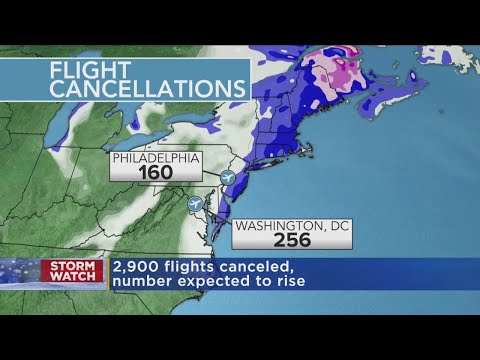 For more infomation >> East Coast Braces For Massive Winter Storm - Duration: 1:11.
  For more infomation >> Late Philippine Archbishop Exhumed for Sainthood Exam - Duration: 0:56.

 For more infomation >> Dr. Wolynn Explains Why HPV Vaccine Is Recommended For Preteens - Duration: 1:05.

 For more infomation >> Why HPV Vaccine Is Recommended For Preteens: Dr. Fu Explains - Duration: 0:38.


Không có nhận xét nào:
Đăng nhận xét