Hello.
Thank you for listening to this narrated presentation about Connecticut's growth model.
This model applies to the Smarter Balanced Summative Assessments in English Language
Arts – ELA - and Mathematics for students entering grades 4 through 8.
The results from this growth model are a key component of Connecticut's Next Generation
Accountability System for districts and schools.
Here are the topics we will cover in this presentation.
1.
What is growth?
How is it different from achievement?
2.
What is Connecticut's approach to measuring growth?
3.
What factors are considered when establishing ambitious yet achievable individual student
growth targets?
4.
How and when will growth be incorporated into the Next Generation Accountability System
for districts and schools?
To understand the differences between achievement and growth, let's start first with a simple
definition of achievement.
Achievement or proficiency or status is a one-time snapshot measurement of a student's
academic performance in a subject area like ELA or Mathematics.
Growth on the other hand is about the change in that achievement score for the same student
between two or more points in time.
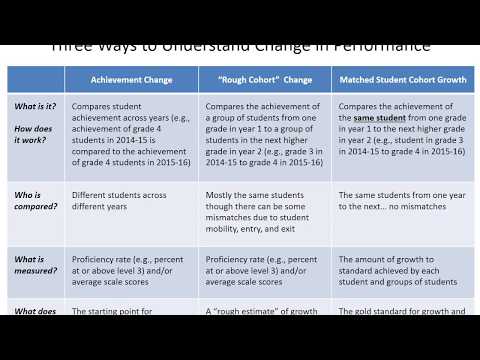
Let's look at three ways to understand change in performance.
The first, Achievement change, simply compares student achievement for the same grade across
years.
For example, a superintendent may say that the proficiency rate of students in grade
4 in our district has increased from 50% in one year to 53% in the next year, an improvement
of 3 percentage points.
While that is technically accurate, this approach is actually comparing the performance of two
different groups of fourth graders.
The difference in performance between the two groups may be due to the fact that the
groups are different to begin with; may be the higher performing group of fourth graders
just started off higher.
The second approach is something we refer to as the "rough cohort" approach.
In this approach, for example, a superintendent may compare the proficiency rate of this year's
fourth graders to that of last year's third graders.
If your district experiences little student mobility and almost all students are promoted
from one grade to the next each year, most of the students will be the same across years.
However, if your district experiences high student mobility, a greater percentage of
students across the two years will be different.
The last approach presented here, the matched student cohort growth, compares the achievement
of the same student from one grade in year 1 to the next higher grade in year 2.
This is generally considered the gold standard for growth because there are no mismatched
students; only those students who are matched across years are included in this calculation.
The matched approach allows us to quantify the amount of growth achieved by the same
students from near the end of one grade, to the end of the next grade – a good measure
of curriculum and instructional effectiveness.
So, what is Connecticut approach to measuring growth?
Connecticut's growth model uses the matched student cohort growth approach.
This approach is very similar to the one used in the past with the Connecticut Mastery Test
or CMT.
The approach is criterion referenced in that the amount of growth made by a student from
one year to the next is evaluated against a fixed standard – or criterion – and
not against how other students grew.
This criterion is based on the Smarter Balanced Vertical Scale for ELA and Mathematics, a
scale that spans the grades from 3 through 8.
The ELA and Math scales range from around two thousand one hundred to two thousand eight
hundred.
The growth model preserves the concept of the Smarter Balanced achievement levels to
support interpretation.
It provides targets and an approach to evaluating growth against those targets that are both
ambitious yet achievable for each and every student.
It expects all students to grow, including those in the highest achievement levels of
3 and 4.
The individual student growth can be aggregated for group level results.
This model was reviewed multiple times with Connecticut's Technical Advisory Committee
which is a group of psychometric experts from around the country.
Now let's look at the factors that are considered when establishing these ambitious yet achievable
growth targets.
Three main factors were considered.
The first is the actual amount of growth achieved by students from 2014-15 to 2015-16.
This growth was evaluated for students who started at different levels of performance
on the vertical scale.
Such a segmented analysis is done because we know that students at different levels
of achievement on the vertical scale often exhibit different amounts of growth.
Therefore, we wanted to ensure that the targets that are established are achievable for all
students.
The second factor we considered is measurement error.
Psychometric theory tell us that a test score is an estimate of a student's achievement
and comes with a certain amount of measurement error.
When calculating growth, we are comparing test scores from two tests, each of which
has some error.
Therefore, when establishing growth targets, we considered whether the growth expectations
exceed the combined average standard error from both tests.
The third factor we considered was whether the targets put students on a path to higher
levels of achievement in future years.
The targets that were ultimately established were achieved by approximately 40 percent
of the matched students.
This is the annual growth target table for English language arts.
Notice the four Smarter Balanced achievement levels on the very top.
Also note that each level is divided into two categories: low and high – to yield
eight total categories for each grade.
The scale score range for each category within each grade is listed in the corresponding
cell along with the requisite amount of scale score growth that is expected.
Here's how you determine the growth target amount for a student.
Let's say a third-grader has a Smarter Balanced ELA vertical scale score of 2350 in the first
year.
This places the student in the High Level 1 category in Grade 3.
By the end of grade 4, this student will be expected to grow 71 points from 2350 or achieve
a vertical scale score of 2421.
Let's take another example.
Let's look at a sixth-grader with a Smarter Balanced ELA score of 2460.
This places the student in Low Level 3 in Grade 6.
By the end of grade 7, this student is expected to grow 53 points from 2460 or achieve a vertical
scale score of 2513.
And this is the annual growth target table for Mathematics that should be read in the
same manner as the ELA table.
It is expected that these growth targets will remain in place for at least three years.
Now let's look at an example of how the individual student level targets play out
in the aggregate.
Let's look at four students who have the exact same target of 60 points.
Student 1 grew 42 points from one year to the next.
This student did not meet the target but achieved seventy percent of the target (42 out of 60
points).
Student 2 grew exactly 60 points.
This student met the target, and achieved 100 percent of the target.
Student 3 grew 66 points.
This student met the target and actually achieved 110 percent of the target.
Student 4 grew 36 points.
This student did not meet the target but achieved 60 percent of the target.
Overall, the growth rate was 50 percent because 2 out of 4 students met their target.
The average percentage of target achieved was 85 percent; that is the average of the
individual student percentages of target achieved.
So, the two aggregate statistics that will be reported are the growth rate and the percentage
of target achieved.
The growth rate is the percentage of students meeting their respective growth target, while
the percentage of target achieved is the average percentage of the growth target that is achieved
by all students in the group.
The growth rate is a binary measure.
It asks a yes/no question.
Did the student meet her target?
The Percentage of Target Achieved on the other hands asks a different question…
how much of the target did the student achieve?
The growth rate is not a continuous measure.
Students nearly meeting the target will be deemed to not have meet the target, even if
they missed it by just 1 scale score point!
On the contrary, the Percentage of Target Achieved is a continuous measure.
Students get credit for any growth up to and even 10 percent beyond the target.
The growth rate is simpler to understand while the percentage of target achieved is a bit
more nuanced.
We will report both measures but will include the more precise, average percentage of target
achieved in the district and school accountability model.
Now let's look at how and when these growth results will be incorporated into the next
generation accountability system for districts and schools.
Growth is indicator 2 of the system.
It will be added starting with the 2015-16 results.
As is the case with the achievement indicator, growth points are awarded for the All Students
and High Needs groups.
For any district or school with growth results, the points for the achievement indicators
will be cut in half.
As a result, growth will carry slightly more weight than achievement in the accountability
system.
In February 2016, the ELA Performance Task was eliminated from the ELA assessment.
Therefore, the ELA results from 2014-15 were rescored after excluding the ELA Performance
Task and using only the computer-adaptive test portion of the assessment.
This enables an apples-to-apples comparison.
For growth calculations, the rescored ELA results will be used.
You may be wondering… so, what about factors like poverty, English language ability or
student disability?
To be clear, Connecticut's model is not a value-added approach where targets are adjusted
or growth results are evaluated using some preconceived expectation of student achievement
that is based on student characteristics.
Connecticut's model does not set different targets for different students based on student
characteristics.
All students at a prior achievement range have the same growth amount expectation.
Some people use the terms growth model and value-added model interchangeably.
Connecticut's approach is indeed a growth model but it is not a value-added model.
There is no mysterious, statistical calculation that is done to precisely quantify the effects
of teachers, leaders, schools or districts on student growth.
Quite the contrary.
Under Connecticut's model, the calculations are transparent.
Anyone with authorized access to student test scores from year 1 and year 2 can determine
if those students achieved their target, and how much of the target they achieved.
To summarize, Connecticut's model is Criterion referenced: It does not depend on
how others do.
It is Continuous: all growth counts; there are no more golden bands.
Unlike in the past, there is no incentive in this system to focus on getting a small
group of students over some magical proficiency bar; instead the message here is that all
growth achieved by all students counts.
It is Familiar: because it uses an approach similar to that used with the CMT
It is Transparent: Local districts and schools can replicate the results; there are no "black-box"
adjustments to the growth results.
It is Collaborative: because the transparency allows for conversation and reflection among
educators.
It is Fair: because it excludes "partial-year" students.
Only those students who were enrolled in the same district or school on October 1 and at
the time of testing are included in the calculations.
It is Achievable: because it is based on the actual growth achieved by Connecticut students
And lastly, it is Ambitious: because the model encourages growth above target.
That bring us to end of this narrated presentation about Connecticut's growth model for the
Smarter Balanced ELA and Mathematics summative assessments.
We hope this has been informative.
Thank you.


 For more infomation >> Jupyter Notebook for TensorFlow - Duration: 2:44.
  For more infomation >> How to Draw Colorful Ice Cream Juice Fruit Coloring Pages for Kids painting with Colored Markers - Duration: 7:41.

 For more infomation >> WJHL, local celebs bag groceries to raise money for United Way - Duration: 2:34.


Không có nhận xét nào:
Đăng nhận xét